This introduction has been adapted from Borja’s bibliography: references.bib PhD thesis [@requena2024].
1 What is machine learning?
With the progress of technology, we encounter increasingly more complex and abstract problems that are hard to formalize mathematically. For instance, the problem of face recognition in images cannot be easily presented in a formal mathematical way, or tasks such as detecting new phases of matter may not even have a known mathematical formulation. Hence, these types of problems cannot be effectively addressed using standard hard-coded algorithms.
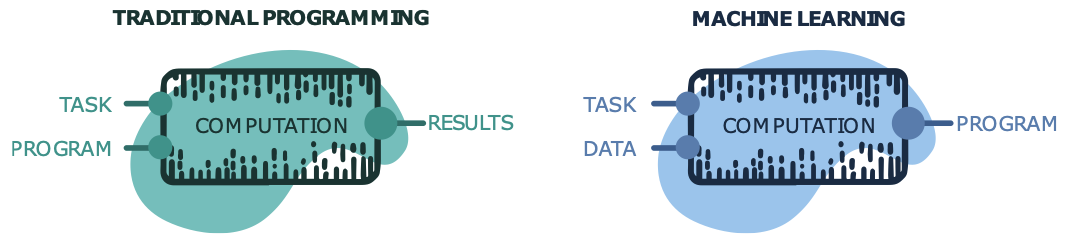
The field of machine learning (ML) emerges as a new paradigm to develop algorithms that are not explicitly programmed, but learned from experience instead, typically in the form of data. Figure 1 provides a visual comparison between traditional programming and ML. In traditional programming, an input task and a program to solve it yield the desired result after some computation. In ML, an input task and related data instances result in a program to solve the task. For example, the data can be pairs of problem examples and their solutions.
This process heavily relies on applied statistics, emphasizing the use of computers to approximate complex functions. Deep learning [@goodfellow:2016], a subfield of ML, is the maximum exponent of this trend. It employs parametrized hierarchical models to extract intricate patterns from data, achieving outstanding results across various tasks.
Figure 1: Traditional programming vs machine learning
Code
import plotly.graph_objects as goimport numpy as npimport plotly.io as piopio.renderers.default ="plotly_mimetype+notebook_connected"# Create figurefig = go.Figure()# Add traces, one for each slider stepfor step in np.arange(0, 5, 0.1): fig.add_trace( go.Scatter( visible=False, line=dict(color="#00CED1", width=6), name="𝜈 = "+str(step), x=np.arange(0, 10, 0.01), y=np.sin(step * np.arange(0, 10, 0.01))))# Make 10th trace visiblefig.data[10].visible =True# Create and add slidersteps = []for i inrange(len(fig.data)): step =dict( method="update", args=[{"visible": [False] *len(fig.data)}, {"title": "Slider switched to step: "+str(i)}], # layout attribute ) step["args"][0]["visible"][i] =True# Toggle i'th trace to "visible" steps.append(step)sliders = [dict( active=10, currentvalue={"prefix": "Frequency: "}, pad={"t": 50}, steps=steps)]fig.update_layout( sliders=sliders)fig.show()